01. Introduction to RStudio
Module items
R Script file code
-
[[Copy the code]] below ➜ Paste into [[RStudio console]] ➜ Hit Enter
-
source(url("https://raw.githubusercontent.com/ttezcann/ssric-reg/refs/heads/main/docs/assets/r-scripts/0-packages-data.R"));
(function(f="01-intro-rstudio.R"){if(!file.exists(f)){download.file("https://raw.githubusercontent.com/ttezcann/ssric-reg/refs/heads/main/docs/assets/r-scripts/01-intro-rstudio.R",f,mode="wb");file.edit(f)}else{download.file("https://raw.githubusercontent.com/ttezcann/ssric-reg/refs/heads/main/docs/assets/r-scripts/01-intro-rstudio.R",gsub(".R","-original.R",f),mode="wb");file.edit(gsub(".R","-original.R",f))}})()
-
Lab assignment
Sample lab assignment
Suggested reading
Verzani, John. 2012. "Overview, Installation." Pp. 1–11 in Getting started with RStudio. Sebastopol: O'Reilly.
Learning outcomes
- Differentiate between the R programming language, RStudio, and RStudio Cloud (Posit)
- Define R packages and explain their purpose in extending R's built-in capabilities
- Describe the structure and purpose of the General Social Survey (GSS) dataset
- Identify the four main panes of the RStudio interface and explain the function of each
- Learn the steps required to run an R script file
Why do we use software for statistical analysis?
- Software helps us collect, organize, analyze, interpret, and design data.
- Many statistical methods are too complex to be calculated by hand or with calculators.
- Software can process repetitive computational tasks rapidly.
- We can save our exact analytical steps as source code, which is a fundamental requirement for making scientific research transparent and reproducible.
- For example, imagine we collected data from 1,000 students and asked their happiness level, stress level, and class status.
- happiness (What's your happiness level?) [1=unhappy, 2=neutral, 3=happy]
- stress (What's your stress level?) [1=stressed, 2=neutral, 3=not stressed]
- class (What's your class status?) [1=senior, 2=non-senior]
-
Then, the data looks like this:
-
id happiness stress class 1 3 2 1 2 2 1 2 3 2 3 2 4 1 2 1 ... ... ... ... 1,000 2 1 2 - When dealing with a dataset of 1,000 students, manual calculation, i.e. how many students are not stressed, becomes practically impossible.
-
[[Software]]
What is [[R]]?
- R is a free, open-source programming language and software environment specifically designed for statistical computing, data analysis, and graphics.
- Free and open source: We can run R from home and use it for the rest of our life.
- Advanced models: Currently, the CRAN package repository features more than 23,000 available packages.
- Growing popularity: Learning R should stand us in good stead for future social research.
What is [[RStudio]]?
- RStudio is an Integrated Development Environment (IDE), which is a software application designed to make writing, editing, and executing R code much easier and more organized.
- RStudio helps keep R more organized and provides an interface by adding many convenient features and tools.
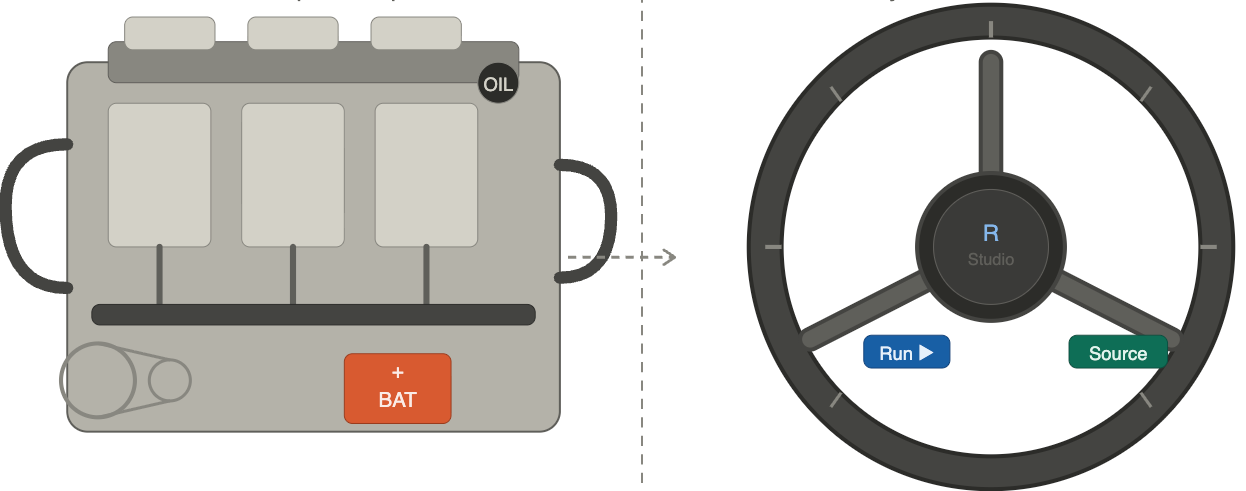
- R is like a car's engine: it works without a wheel but impossible to steer.
- RStudio is like a wheel: it gives you control and direction. The engine still does all the work. R always works at the background.
- RStudio is like a wheel: it gives you control and direction. The engine still does all the work. R always works at the background.
What is [[RStudio Cloud]]?
- RStudio Cloud (currently known as Posit Cloud) is a browser-based version of the RStudio environment where you can write code, run analyses, install packages, and manage projects without installing R or RStudio on your own computer.
- Although the instructions are for RStudio Cloud, all steps are the same in other options.
- Creating a “free account” will allow you 25 hours per month of connect time.
- Although the instructions are for RStudio Cloud, all steps are the same in other options.
Options to use RStudio
- There are three options to use RStudio:
Data: General Social Survey (GSS)
- We'll use General Social Survey ([[GSS]]) for the modules.
- The GSS gathers data on contemporary American society in order to monitor and explain trends and constants in attitudes, behaviors, and attributes.
- Hundreds of trends have been tracked since 1972.
- In addition, since the GSS adopted questions from earlier surveys, trends can be followed for up to 80 years.
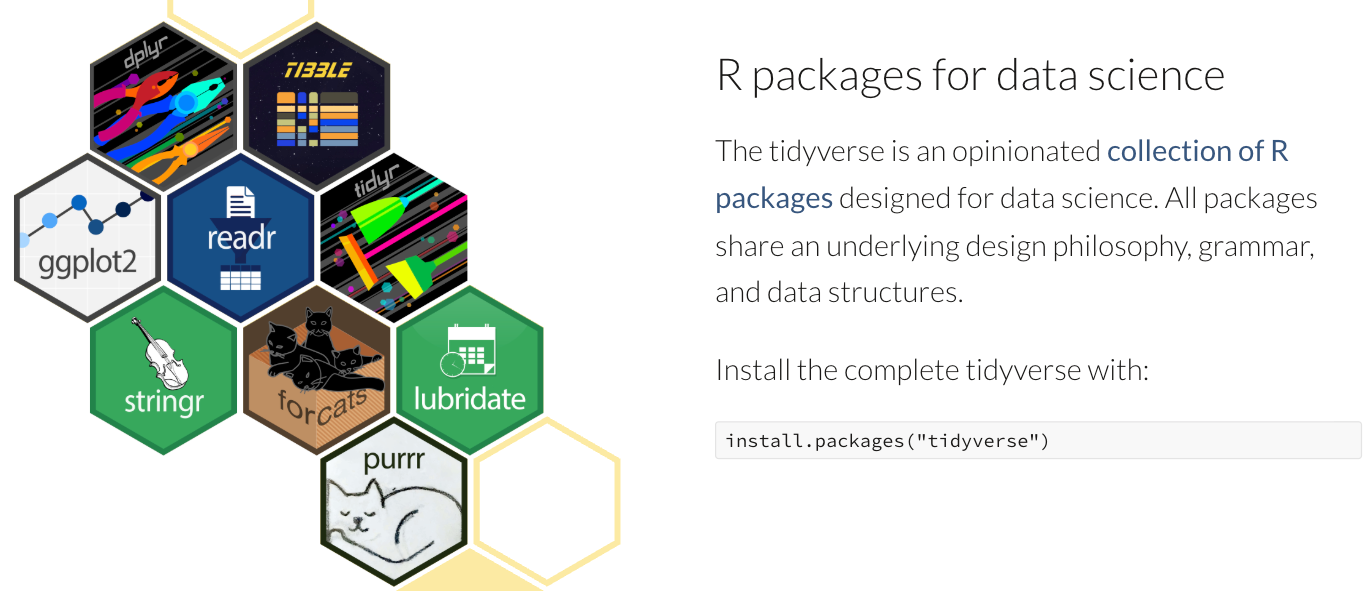
Packages
- [[R packages]] are written by community contributors, and they are available for anyone to use.
- They plug into RStudio to expand the software's built-in capabilities.
- There is a massive ecosystem of thousands of free, open-source packages created by the community.
- Most are hosted on CRAN (the Comprehensive R Archive Network), while development versions are often shared on platforms like GitHub.
- Packages provide pre-written tools for highly specific tasks, such as data visualization and complex statistical modeling.
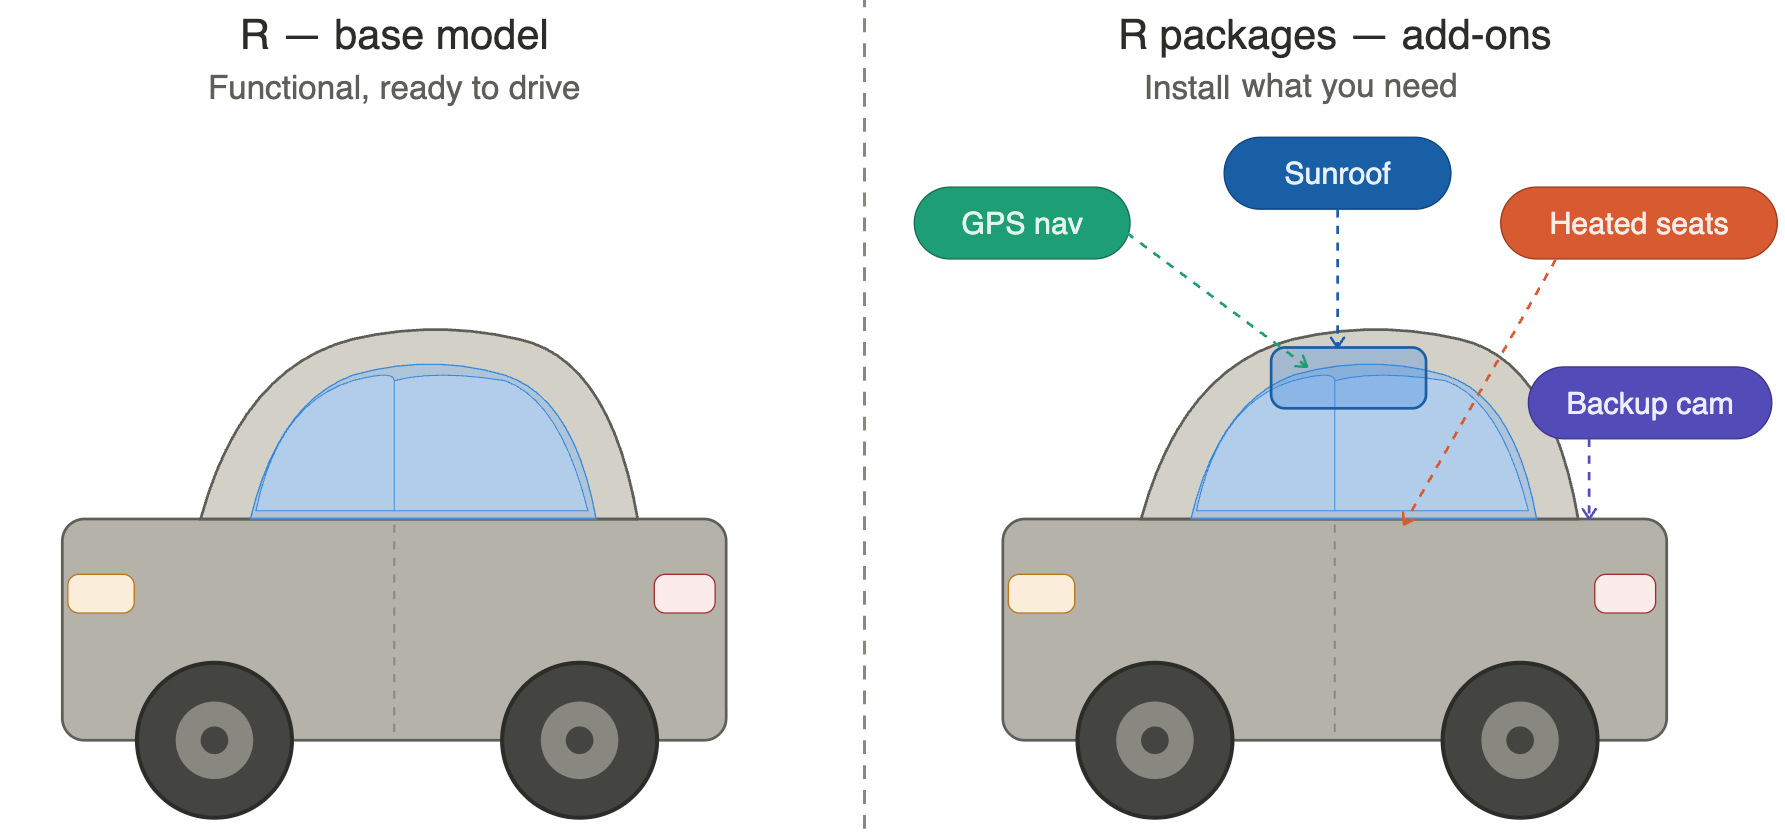
- R is like a base car. It's functional, ready to drive. It has an engine, steering, and brakes.
- R packages are like add-ons: GPS navigation, sunroof, heated seats, backup camera.
- We will use several packages.
- Tidyverse is one of the packages we’ll use.
- Tidyverse is one of the packages we’ll use.
[[Steps of using RStudio]]
[[Copy the code|ref]]: Copy the specific R script file code
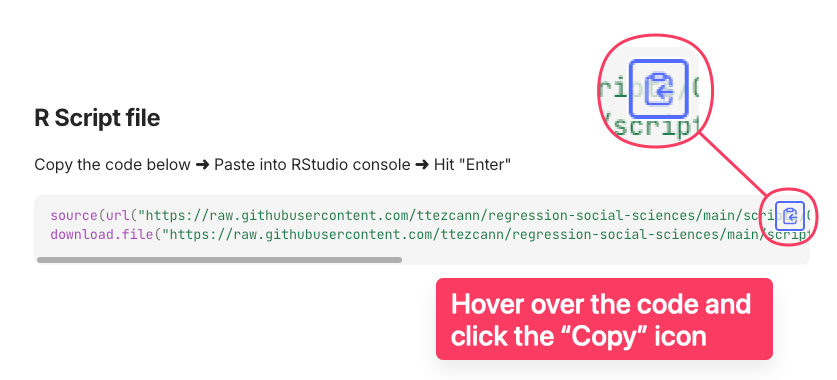
- You will see a code box at the top of each module page.
- Hover over the code and click the "Copy" icon.
- Each module comes with a different R script file. This process should be done for each module, and should be done only once for each module.
- If the codes are accidentally changed, run the specific R script file code again, which will upload the original R script file with the extension
_original.
- If the codes are accidentally changed, run the specific R script file code again, which will upload the original R script file with the extension
Open RStudio Cloud website: Use [[RStudio console|ref]]
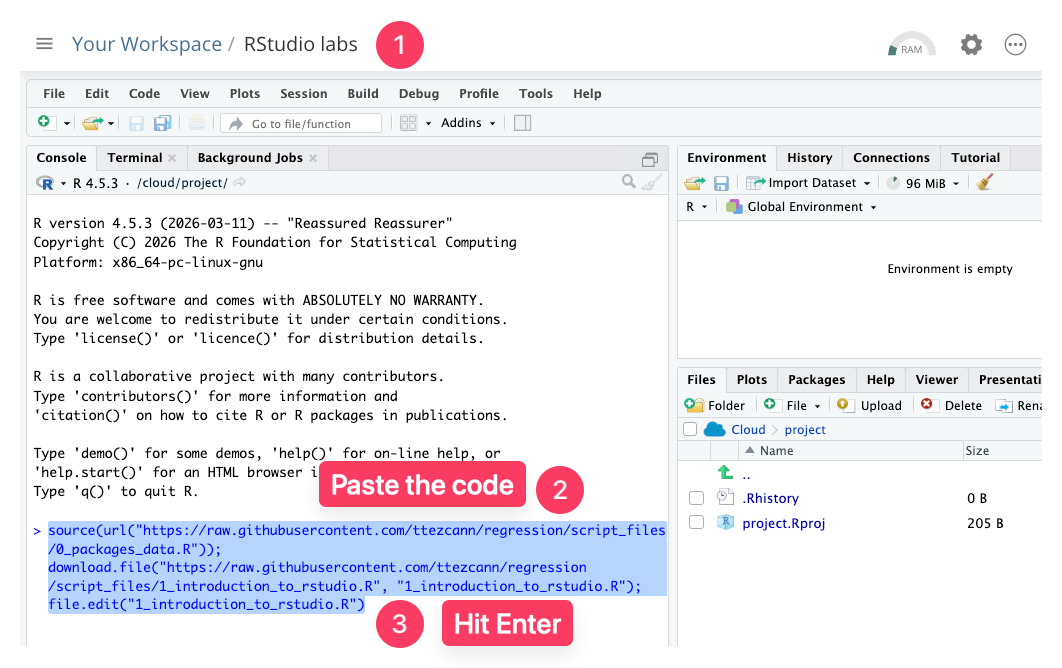
- Open RStudio Cloud website and go to "RStudio labs".
- Paste the code into [[RStudio console]].
- Hit Enter
- The code you paste will: (1) Install and load all required packages, (2) download the "gss" data, (3) relabel the variables, (4) add helpers, and (5) open the script file.
[[Wait]]
- You will see a ⛔ STOP ⛔ sign.
- Codes are running in the console. You should wait until the ⛔ STOP ⛔ sign disappears and no more code is running.
-
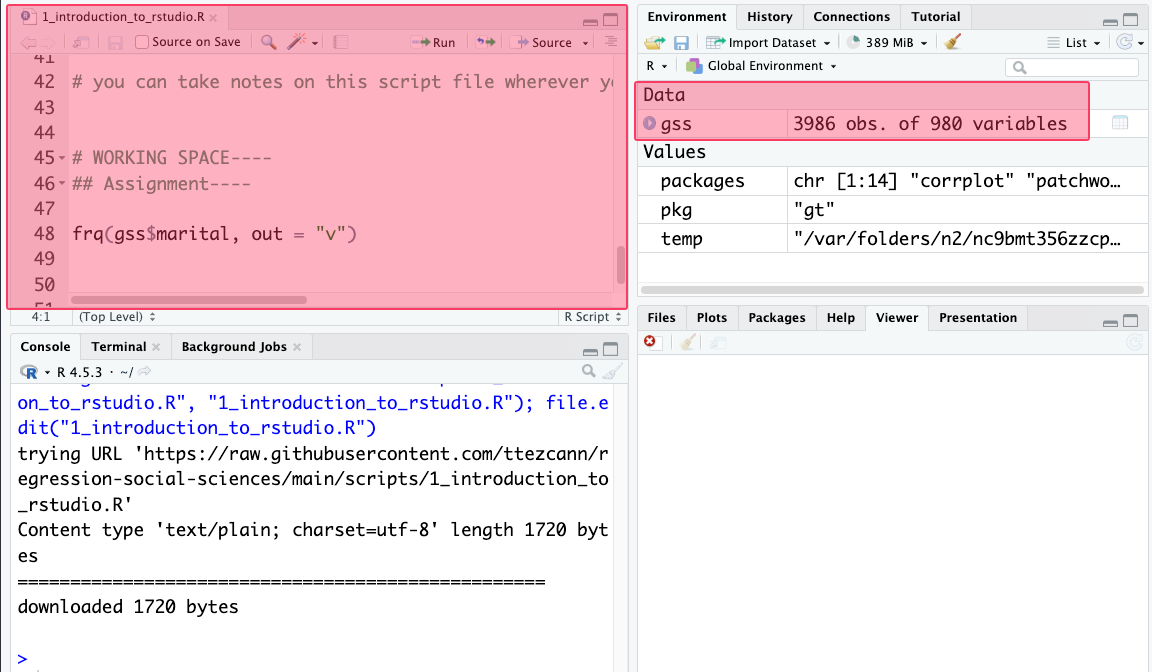
When you see the script file opens and "gss" appears under the "Environment - Data section," everything is all set.
-
Initial setup
The initial setup takes approximately 5–10 minutes; thereafter, it will take only 5 seconds.
-
[[Highlighting and running|ref]]
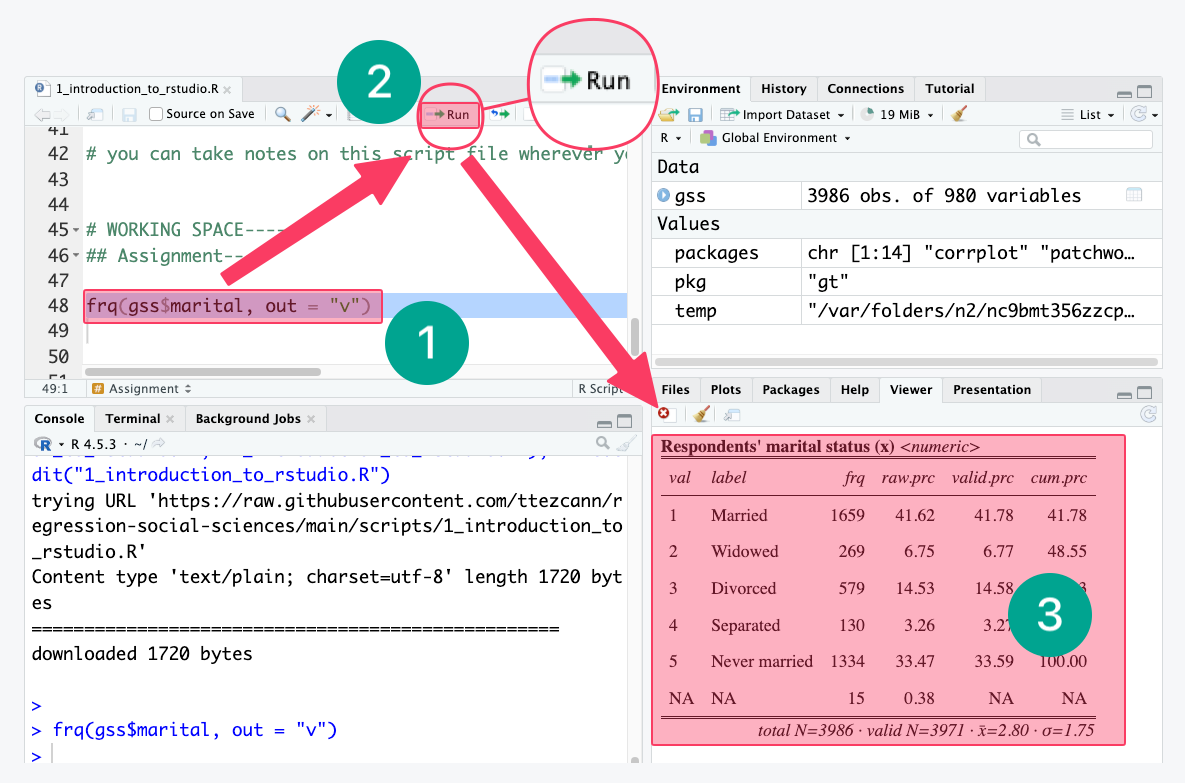
- As R script files are simply text files, we need to highlight the codes and run. Without highlighting and running, the codes will not work.
- We highlight the code.
- Click “Run”.
- Clicking “Run” generates the analysis (a frequency table, for this example)
- As R script files are simply text files, we need to highlight the codes and run. Without highlighting and running, the codes will not work.
[[RStudio interface]]
Main look
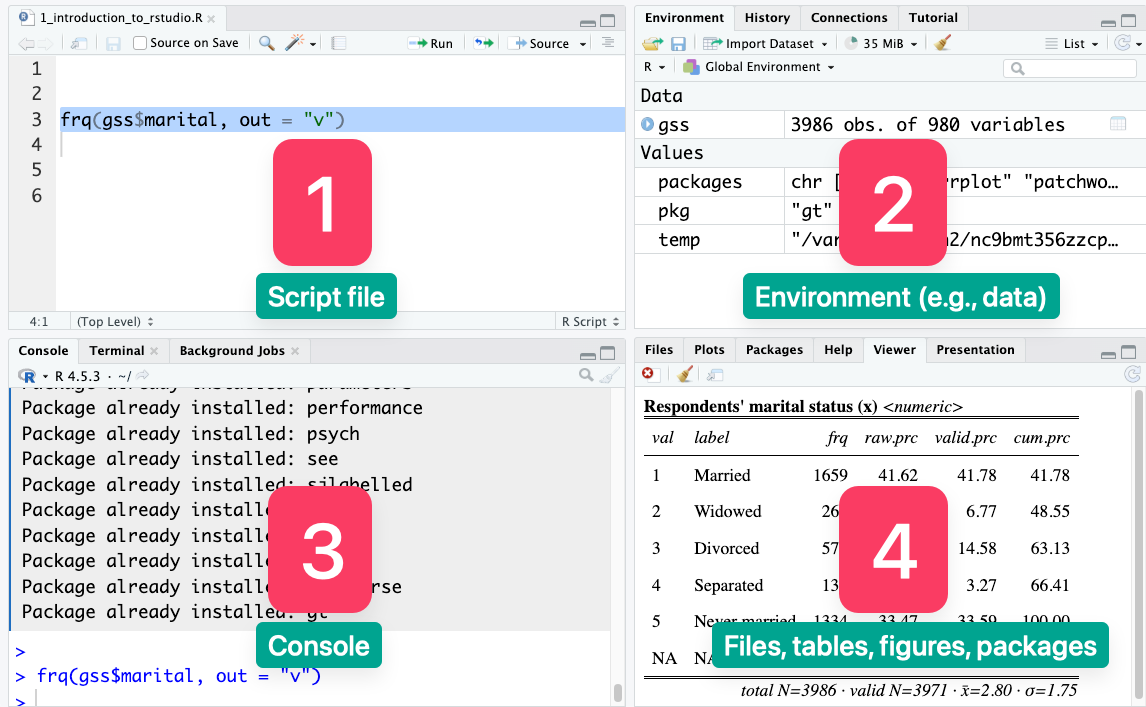
- Script file: This pane is where we write, edit, and save our R code or scripts.
- Environment: This pane shows the objects currently loaded in memory, such as datasets, variables, and functions.
- [[RStudio console|ref]]: This pane shows the codes that were run, immediate output, or error messages.
- We will paste the script file codes here and hit "Enter" when we open RStudio.
- Files/plots/packages/help: This pane lets us browse files, view tables and figures, manage packages, and access help documentation.
More detailed look
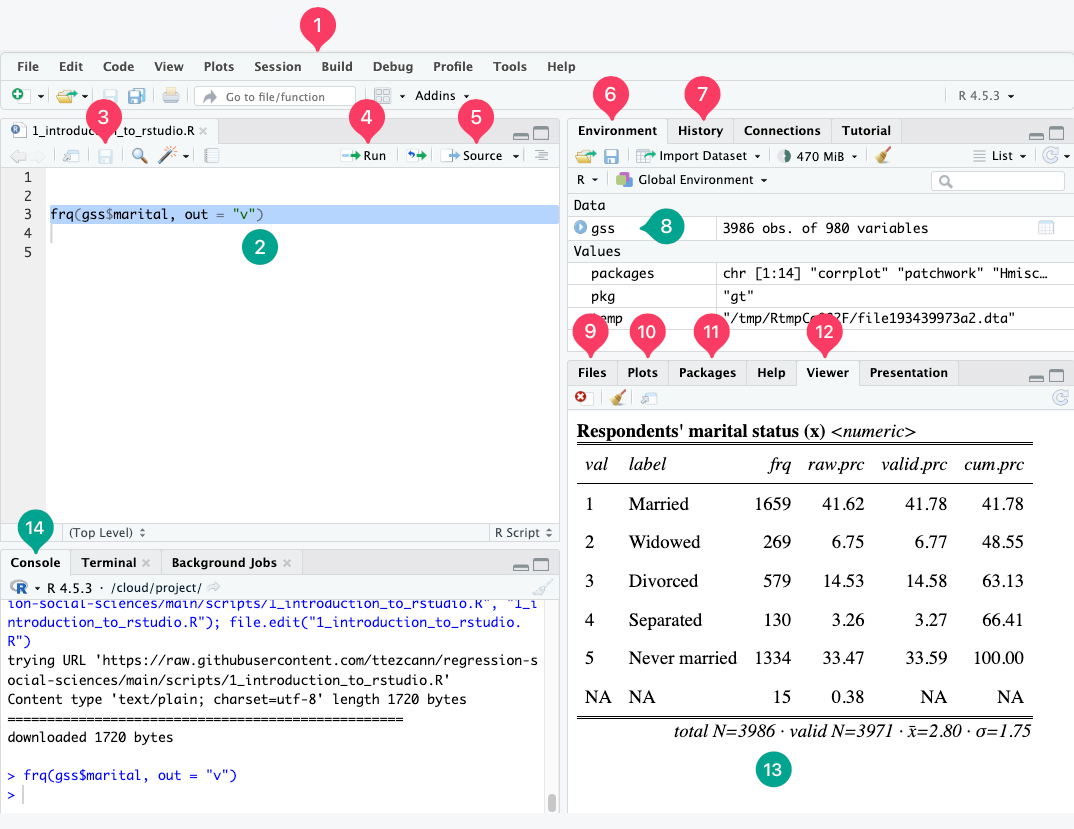
- Menu bar: The top strip with File, Edit, Code, View, Plots, and other menus. This is where you access all global settings and commands.
- Script editor: The upper-left panel where you write and save your R code. Code here does not run until you tell it to.
- Save button: Saves your current script to disk.
- Run button: Executes the currently selected line(s).
- Keyboard shortcut: Ctrl+Enter / Cmd+Enter
- Source button: Runs the entire script from top to bottom, as if you submitted it all at once. Useful for running a complete analysis.
- Environment tab: The upper-right panel shows every object currently loaded in memory.
- History tab: This contains the history of all the commands we have recently run. We can go to this tab and re-run any commands we have run previously.
- Data: This is where all your currently open data will appear. GSS data is there.
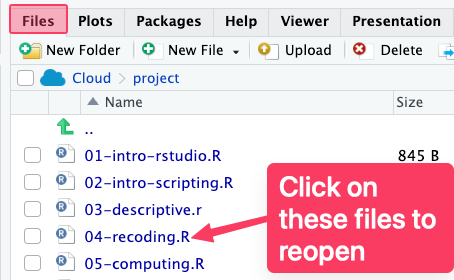
- [[Files tab|ref]]: This shows the files and folders within the project folder.
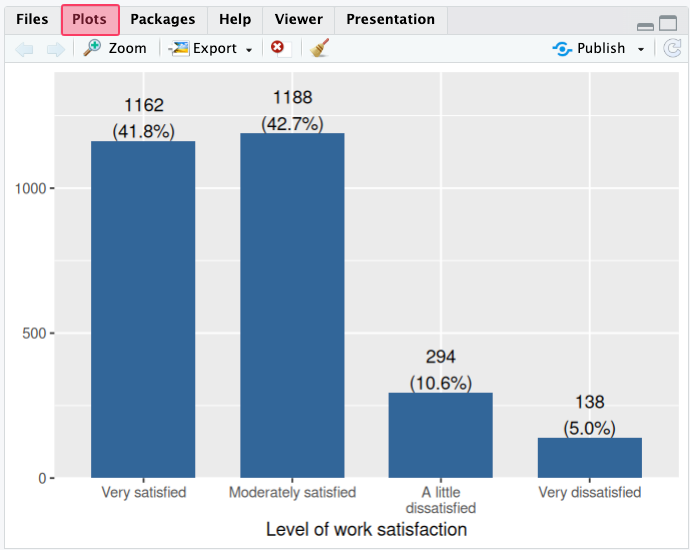
- [[Plots tab|ref]]: This displays any graph you produce.
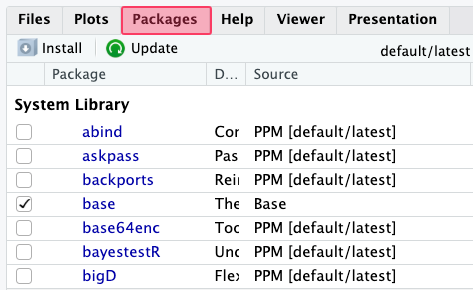
- Packages tab: This will show all the installed and loaded packages.
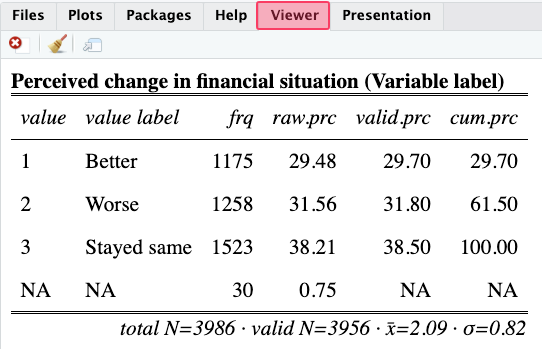
- [[Viewer tab|ref]]: This displays any table you produce.
- Table view: The frequency distribution of the marital status variable is here. You highlight the code in the script file, click "Run", and the table appears here.
- [[RStudio console]] tab: This shows the codes that were run, immediate output, or error messages.
- We will paste the R script file codes here and hit "Enter" when we open RStudio.